


© The Indian Express Pvt Ltd
Tags:
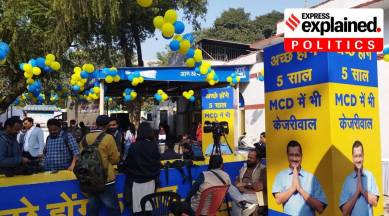
The first election to the Municipal Corporation of Delhi (MCD) after its reunification saw an end to the BJP’s 15-year rule. The Aam Aadmi Party (AAP) has won 134 of the 250 wards, the BJP has finished with 104, and the Congress has been reduced to just 9 seats. In 2017, the BJP won 181 of the total 272 seats in the three MCDs; AAP and Congress won 49 and 31 seats respectively.
How voters choose
An important and evident principle in any election is that voters reward good performance. Data from a recent study by Lokniti-CSDS seems to suggest that AAP received a boost in the MCD elections from a positive assessment of the performance of its government in Delhi.
More than three-fourths (76%) of voters said the condition of government schools had either improved or was as good as earlier, and 87% said power supply — a main focus area of Delhi’s Arvind Kejriwal-led government — had either improved or was as good as before. Half the respondents (50%) reported that government hospitals had improved, and 11% said they were as good as before. (Chart 1)

Schools, hospitals, power, and sanitation are classic issues in any civic election. It is important to note, however, that in Delhi, “government” schools are run by both the MCD and Delhi government. Primary education (up to Class 5) is mainly the responsibility of the civic body, which does not run schools for students in higher classes. Also, “government” hospitals in Delhi are run by both the Delhi government (DDU, GB Pant, GTB hospitals etc.) and the MCD (such as Hindu Rao and Kasturba hospitals). There are also schools and hospitals that are run by the central government.
The issue of sanitation and waste management figured prominently during the campaign. The CSDS survey data show that among the main civic amenities, voters were the most unhappy with “sewer/drains” — 41% said their condition was either as bad as before or had worsened. Sanitation is entirely an MCD issue, and AAP promised to focus on it during the election campaign.
Who voted for AAP
In the survey conducted before the election, 50% or more among Muslims, other religious minorities, and Hindu Dalits expressed their preference for AAP. Among Hindu upper castes, almost half (49%) said they would vote BJP; 34% preferred AAP. OBC respondents were split almost equally — 44% for AAP and 42% for BJP. (Chart 2)
Among poor and lower class voters, 45% and 49% respectively preferred AAP; these numbers were 28% and 37% respectively for the BJP. Middle class voters supported the AAP and BJP equally (40% each). (Chart 3) Close to half of women respondents (47%) expressed their preference for AAP; among men, 39% each supported the AAP and BJP. (Chart 4)
Double engine?
The survey showed no significant variation in overall satisfaction with the performance of the AAP government in Delhi and the BJP-led government at the Centre — around 65% of respondents said they were satisfied with both governments. This confirms that voters are drawing a clear distinction between politics at the central and state levels. Voters in Delhi have backed the BJP at the Centre and AAP at the state over two Lok Sabha and Assembly election cycles now, and the preference for the AAP in the civic elections suggests continuing trust in the party over local issues.
However, the BJP’s vote share in the MCD election rose to 39.09% from the 36.8% in 2017, suggesting that voters did not reject the party altogether. Both BJP and AAP (42.05% from 26.23% in 2017) gained from the decline in the Congress vote share from 21.09% in 2017 to 11.68% in 2022.
The authors are researchers at Lokniti-CSDS, Delhi

